Join the Web Performance Team at the Wikimedia Foundation!
19 May 2017
The Wikimedia Foundation is looking for a Performance Lead (Engineering Manager) to join our team! This is a great opportunity for you if you are into performance: Wikipedia is one of the largest sites in the world, we are a small team of really nice people that loves performance and the Wikimedia mission statement is fantastic. You can work remote. And we have really interesting performance work coming up!
But before you apply I wanna give you a brief introduction of what we do.
The Performance team
We are a four member team: Aaron Schulz, Gilles Dubuc, Timo Tijhof and me Peter. We've been working on different focus areas: Outreach, monitoring, improvement and knowledge. Gilles, Timo and Aaron have been working really hard on improvements (there are blog posts coming about what they have done!). My main area is monitoring so I will mostly talk about that.
But first one more important thing: Everything we do is open. The code we write is Open Source. The tools we use are Open Source. Our workboard are open for everyone. And the metrics we collect are available at our Grafana instance. Check them out!
Monitoring performance
The goal by monitoring performance of Wikipedia is to make sure the content is easily accessible for people all over the world. With the monitoring we want to:- Find performance regressions (so we can fix them).
- Know the performance for real users (so we know where we should focus on improvements).
- Validate performance improvements (if we improve performance, we want to know about it).
First: What is performance?
We want to measure performance that impacts the user and measure the user experience. That is hard. Historically the performance metrics has been focusing on browser performance and not so much on the user experience. Today we use RUM and synthetic testing to monitor the performance:- Real User Monitoring (RUM) - we use browser standard APIs to collect performance metrics. The good thing is that these are metrics from real users, the downside is that at the moment they don't give a perfect view of the user experience.
- Synthetic testing - we use a browser in an isolated lab environment and records a video of the screen. We analyze the video to get better metrics that reflects user experience. But we only test a couple of pages, so we get a narrow view of the user experience.
Real User Monitoring
We collect data using our Navigation Timing extension, where we sample and collect 1 of 1000 requests (checkout out our traffic in the cool tool our analytics team has built). At the moment we collect data from the Navigation Timing API v1, firstPaint from Chrome/Internet Explorer and two user timings through the User Timing API. You can look at the data we collect here. You can see that we focus on median, p75, p95 and p99. We store the data in Graphite and graph it using Grafana.
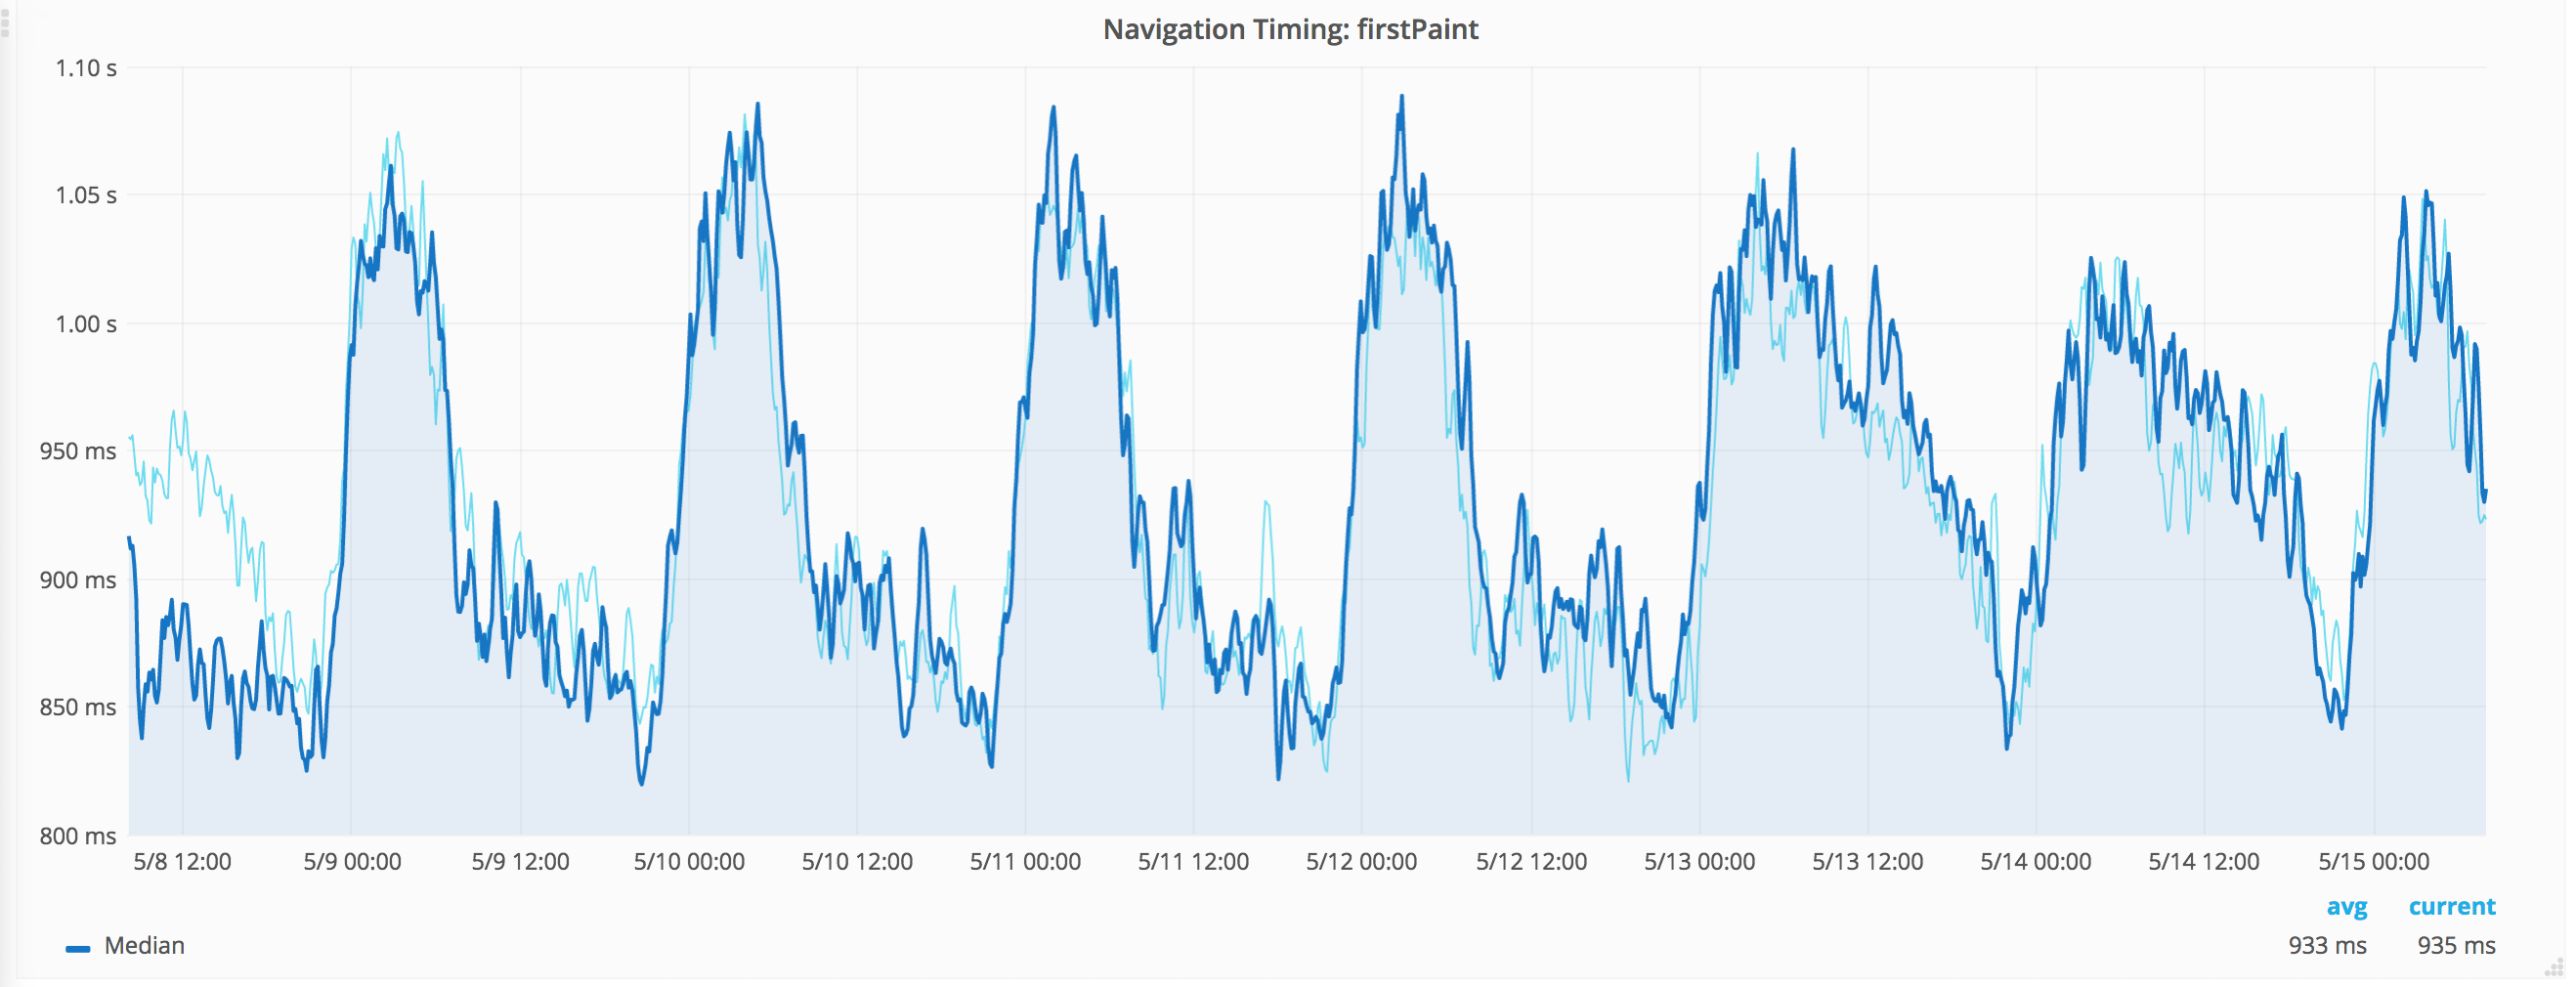
Another metric that been our focus area is save timing: How long time does it take for a user to save an article. But our main focus has been firstPaint.
First paint median compared with one week back. Click the image to go to Grafana.
Real User Monitoring - next step
What can we do to make our real user monitoring better? We've been thinking of a couple of things and you can probably help us come up with more things :)
- We really want to find metrics that better represents user experience! Browsers are adding new APIs like PerformanceObserver and First Meaningful Paint that will help us.
- How should we bucket the RUM data? We have buckets by browser (version) and country today. Any important factors that we miss?
- Measure performance in our iOS and Android applications! So far we have only focused on the web.
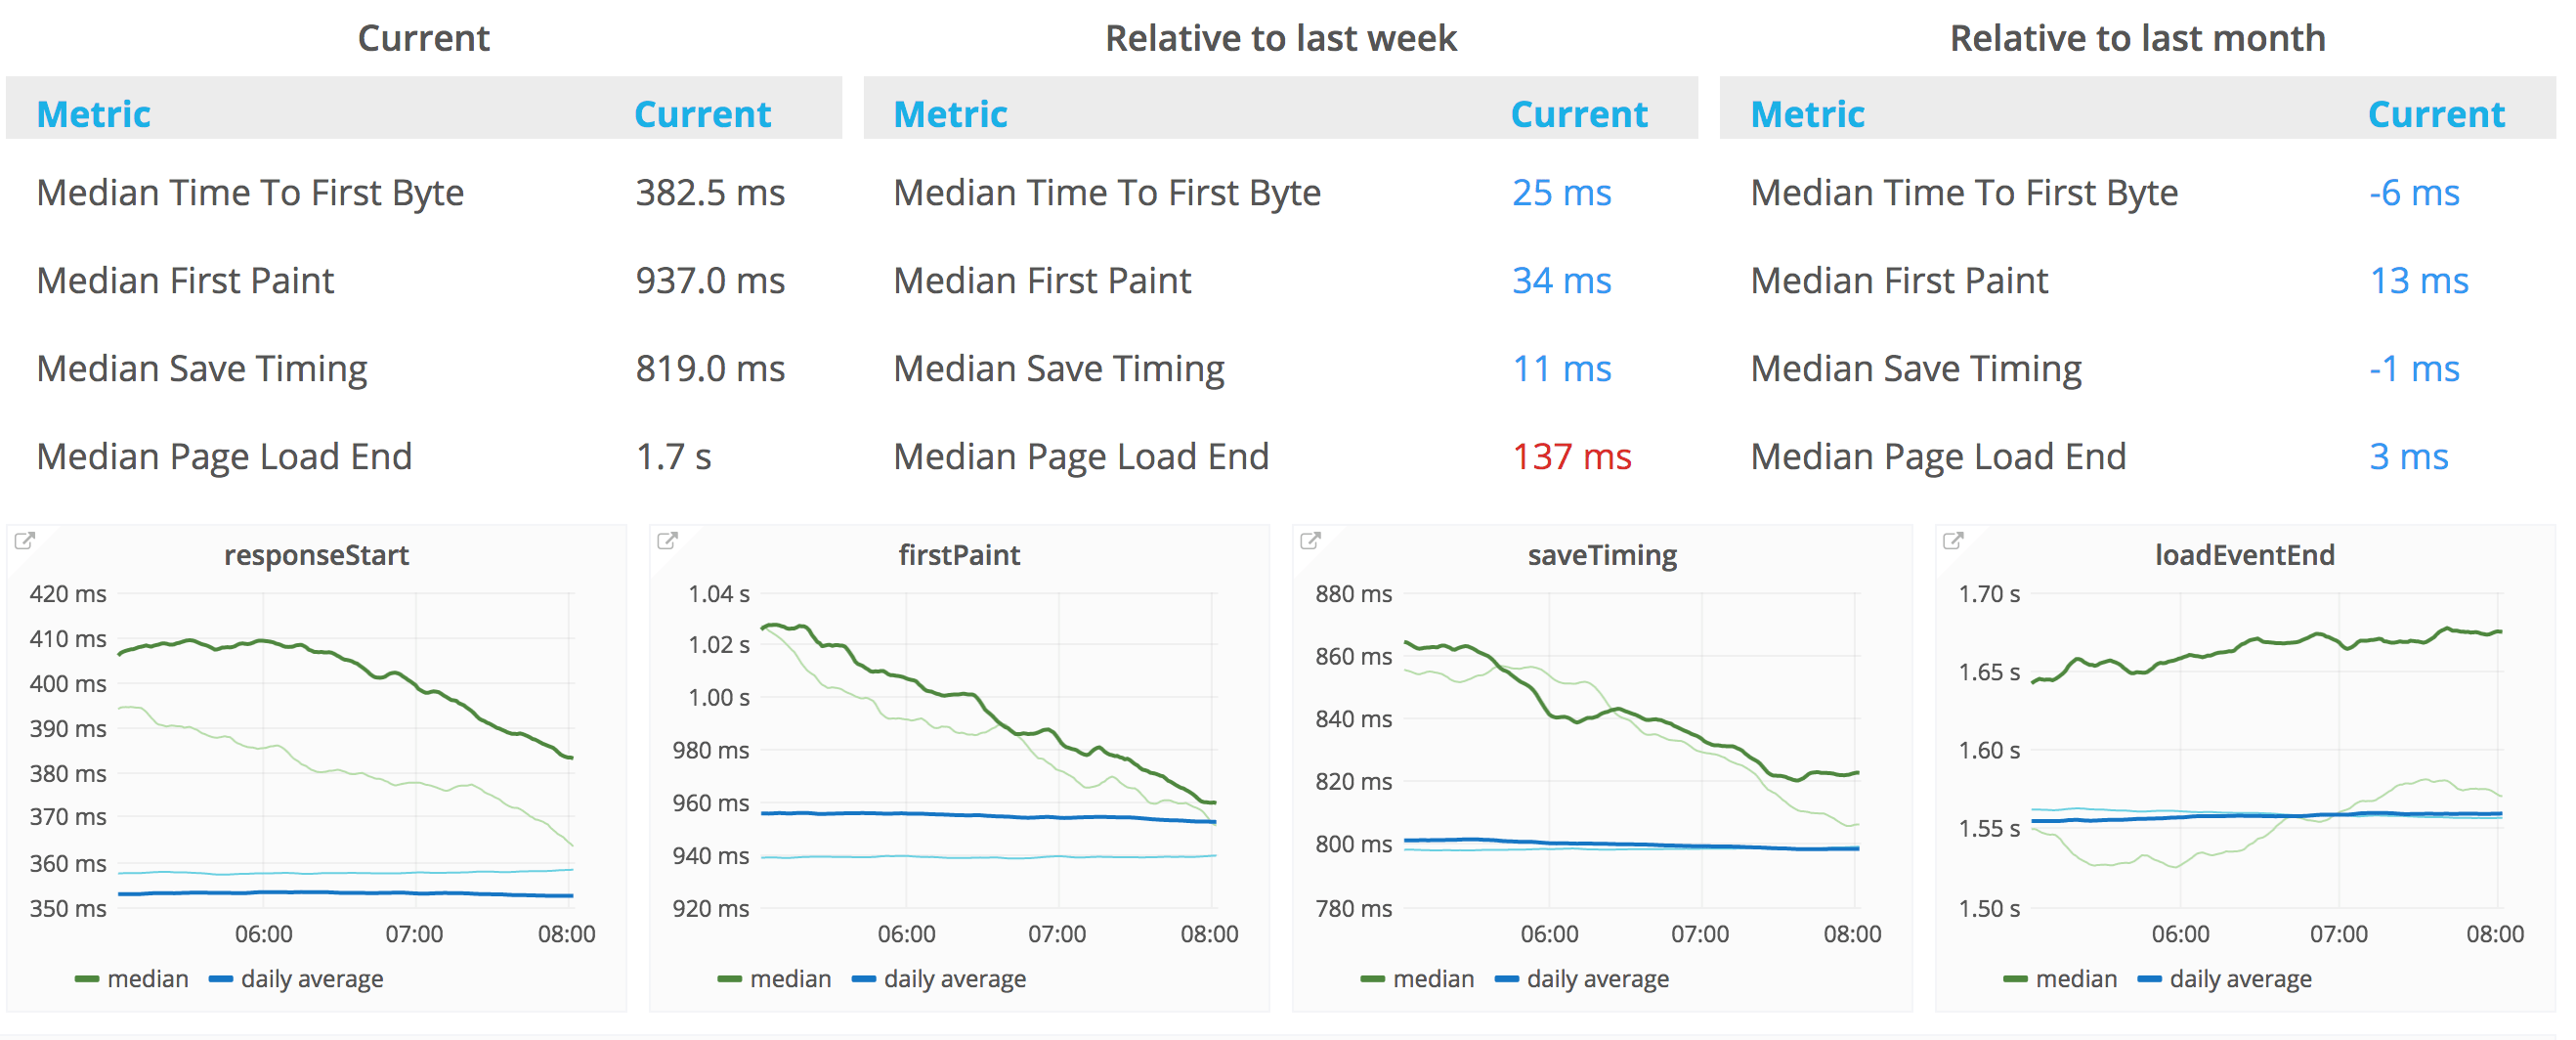
One last thing about our RUM metrics: We compare our metrics with ones we got one week/one month back, checkout our RUM dashboard.
How we are doing. Click the image to go to Grafana.
Synthetic testing
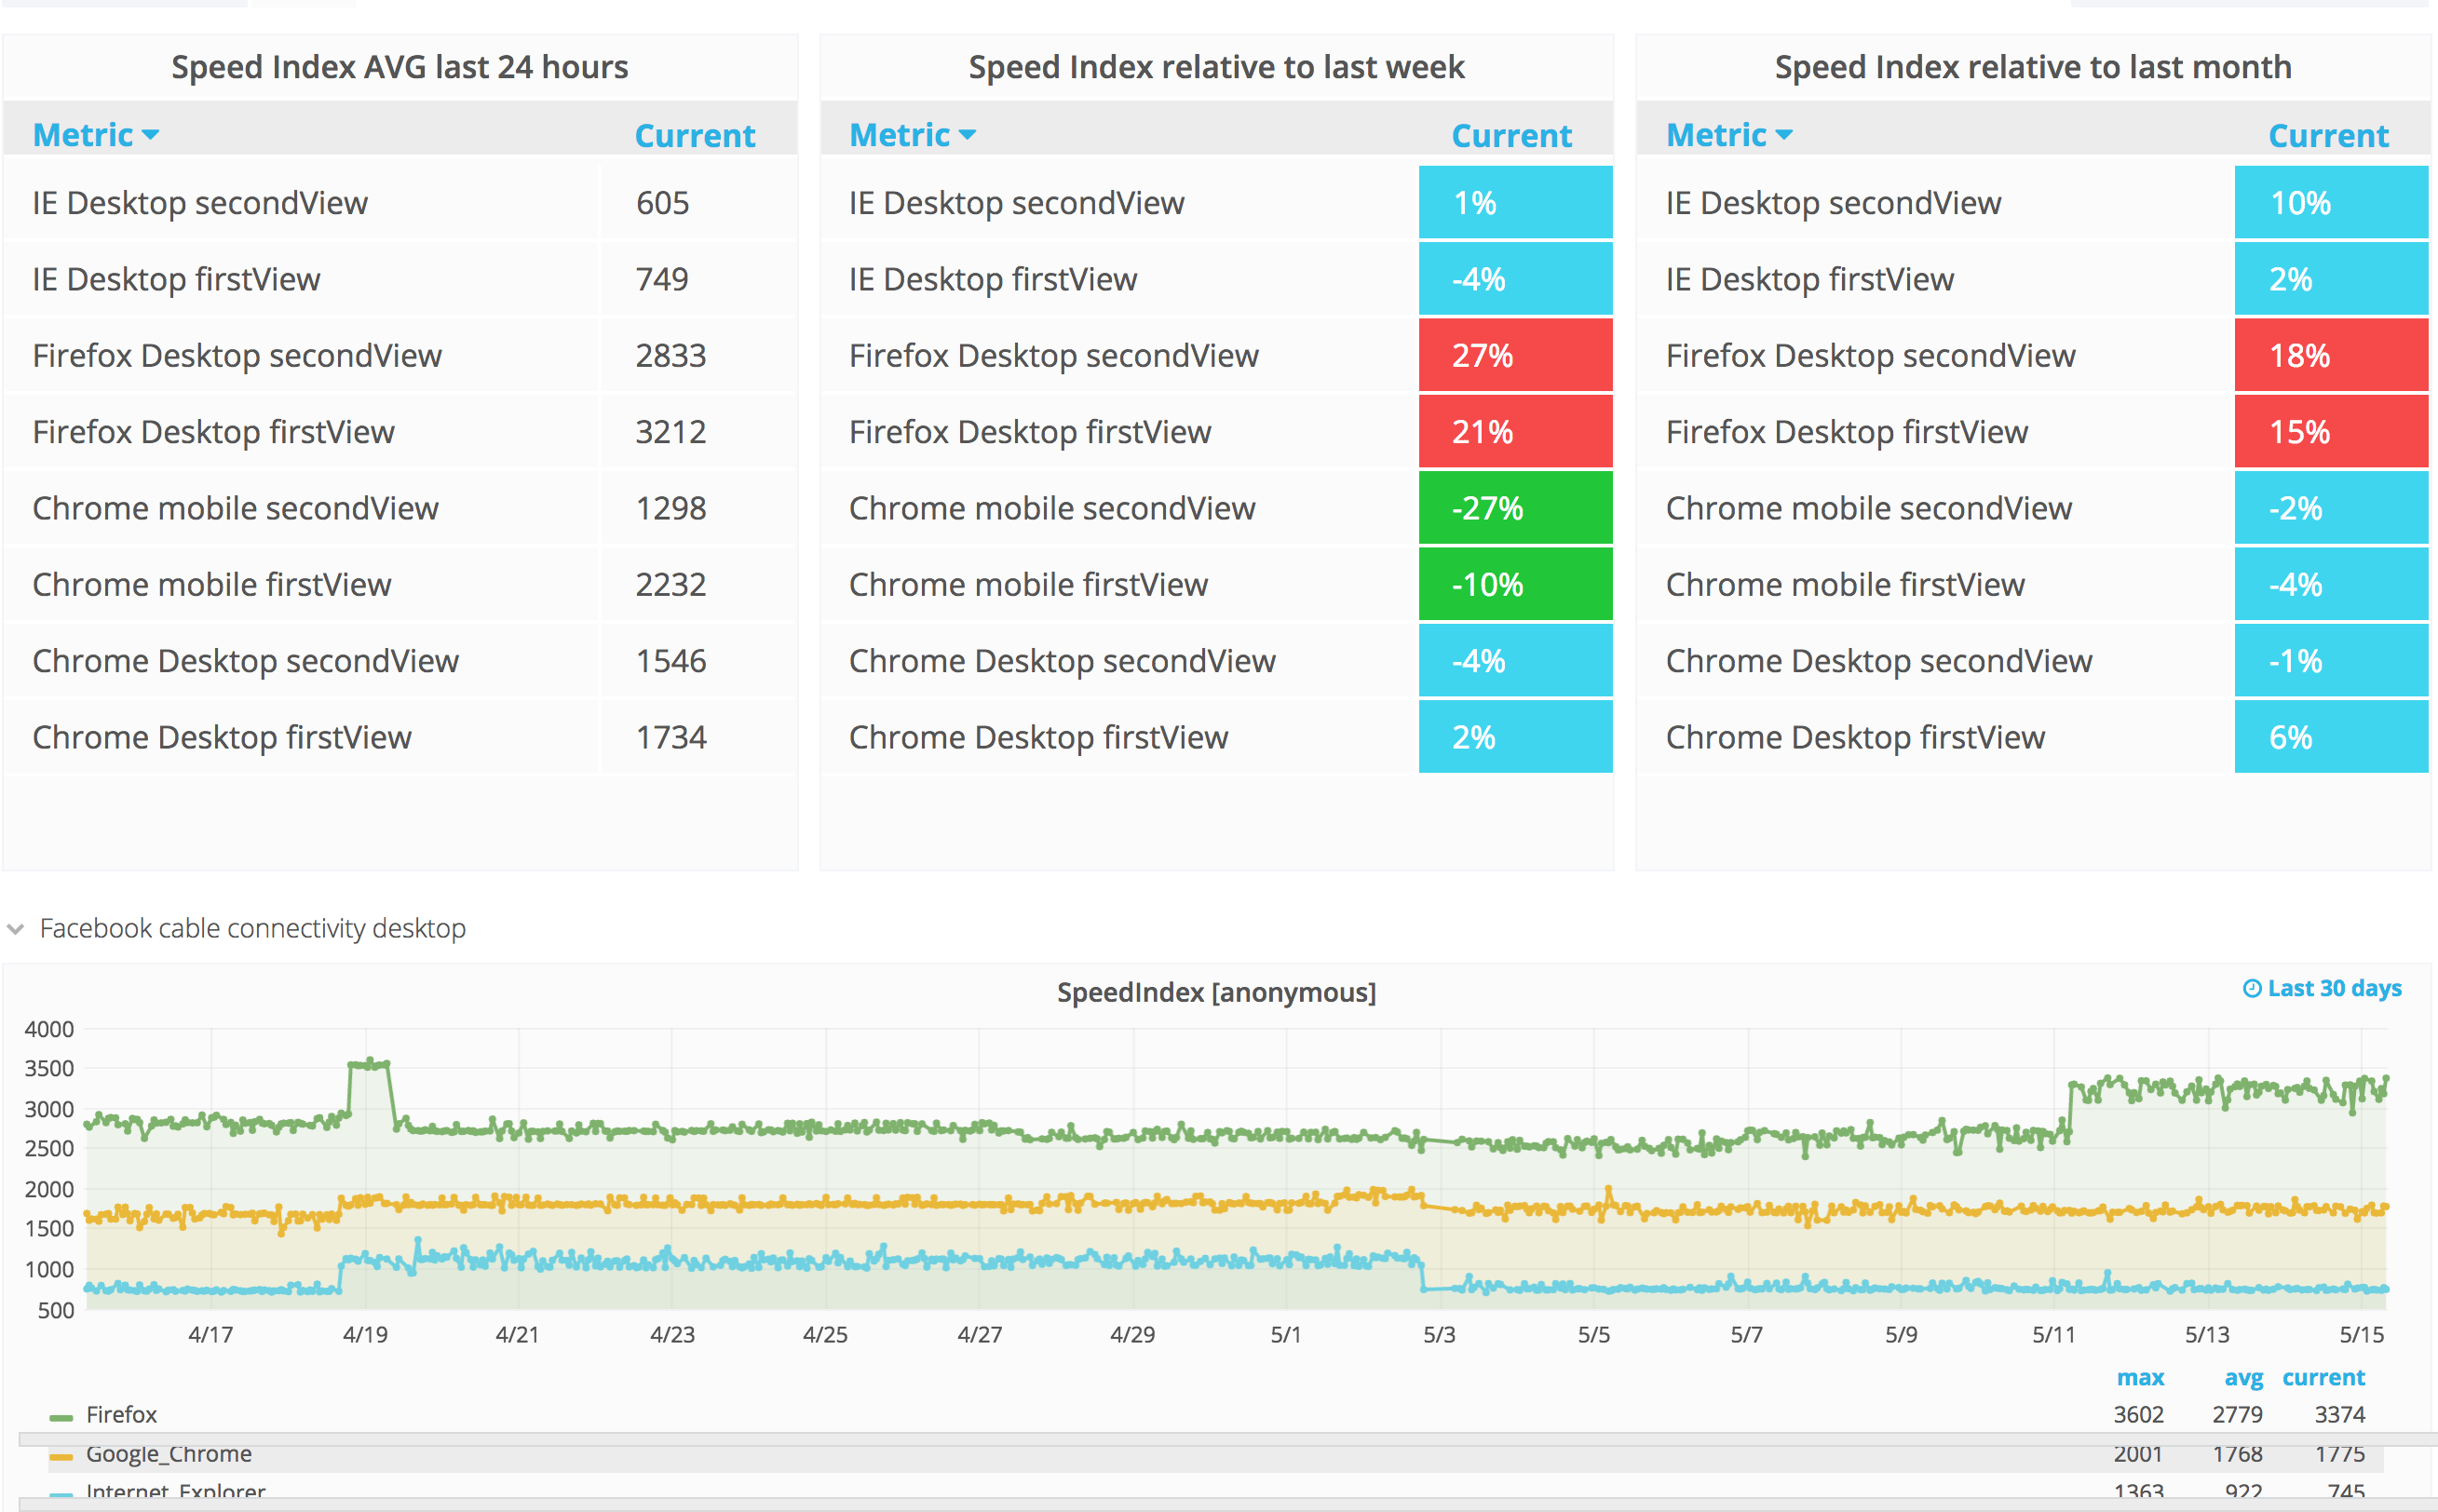
We do our synthetic testing with WebPageTest. We have an instance running on AWS and try to squeeze in as many test as possible within one hour. We use WebPageTest because it gives us metrics we can't get from RUM like SpeedIndex and (real) firstVisualRender.
We test three pages in Chrome, Firefox and Internet Explorer for the first view, then we do the same with second view (hitting one URL and then go to another). We also test a couple of pages as a logged in user.
Another good thing WebPageTest gives us is a history so we can go back in time and compare how the page is loaded looking at waterfall graphs.
Metrics from our synthetic testing. Click the image to go to Grafana.
Synthetic testing - next step
How can we do our synthetic testing more valuable? Maybe you can help us :) We've been thinking of a couple of things.
- Test on real mobile devices! Today we do our mobile testing on emulated devices and a couple of free devices at WebPageTest.org. We need to test on real devices.
- We focus too much on first view. How can we better measure real world behavior (cold cache vs items in the cache)?
- Can we make our metrics more stable by using other tools or another server setup?
- How many URLs should we test? It's easy today to pick up page specific changes instead of changes that are relevant to the whole site.
Is that it?
No. We have so many more things we wanna do. Performance test our code before it reaches production. Performance improvements for the users with the worst performance. How can we make the site faster now when we use HTTP/2? And more. Checkout out our backlog to read all about it.
I hope you now know a little more of what we do. If you have questions before you apply, my DMs on Twitter are open :)
Written by: Peter Hedenskog


