Speeding up www.sitespeed.io (part 1)
24 February 2014
Almost five months ago I released sitespeed.io 2.0 and I haven't had time to write a blog post about all the new things. The most important change is the support of fetching Navigation Timing metrics using Browser Time and I will show how you can use it in this blog post.
Going live with 2.0 I wanted to speed up my documentation site. I haven't spent so much time making the website fast, but of course I want it to be because it's the home of sitespeed.io. I will do a couple of blog posts where I try to make it faster. In this first post I will test if a CDN will help me out.
The stack
I run sitespeed.io on a shared US based host along with my other websites (a personal blog and a couple of other small sites). I use it because it is cheap and had a little bit better TTFB than my last host. I use Jekyll to create the HTML pages & deploy using Glynn. I don't use gh-pages of Github because I want to be able to set the HTTP headers that I want. The site is plain HTML using a slightly modified version of Bootstrap to get the look & feel.
I know there are a couple of things how I use Bootstrap that isn't perfect for speed: First, I include the CSS inline of the <head> tag on all pages to speed up my site on mobile. That's usually good as long ad you serve the CSS needed to display the above the fold content. But I include ALL the CSS , that's 57 kb of CSS on every page. That is a problem because that is extra bytes per page and extra work for the browser to parse.
A cool thing in Chrome: do you want to see how many CSS rules that are used on a page compared to how many you include, use dev-tools and choose Audits and Web Page Performance and then run. It looks like this:

83% of the rules are not used on the start page, that is a bad number. I include too much unused CSS.
One other thing with Bootstrap is that it need Javascript for the mobile menu. That is normally ok (Javascript isn't evil) but it uses JQuery, so I need to load 93 kb extra Javascript and together with the Bootstrap Javascript it is 120 kb (39 compressed). It is minified & compressed and load right before the end body tag, but it is still one extra request and the Javascript needs to be parsed by the browser.
The start point
First of all; the MOST important thing when you do changes is to measure. Measure is knowing. I will start testing the origin server. Lets analyze the site and see the numbers.
The analyze
I got sitespeed.io installed on my Mac (using Homebrew) and I run it like this:
sitespeed.io -u http://www.sitespeed.io -d 2 -c chrome -z 30
I feed the start URL, tell the crawler to crawl two steps deep ("-d 2") , collect Navigation Timing metrics ("-c chrome") using Chrome and test each page thirty times (-z 30). I test each URL 30 times to get a good base for the timing values and use Chrome because it reports the first paint time (the time when things starts to happen on the screen for the end user). I use the default rules for desktop and run it on my own desktop running the test from Stockholm Sweden.
Origin server
I'll will start checking the summary page. Lets skip how good the rules match for now and check the actual timings. Six pages were tested 30 times each, the large numbers are median values and the small numbers is the 90th percentile (check the full result here):

OK, even your boss understands this: Some areas are red and some are yellow, that is not good. Check the firstPaintTime, that's when the browser reports it starts doing something on the screen, we want that to happen as fast as possible, to give a feeling that the site is instant. 626 ms is not extremely bad but not good either, you surely want to go under 500 ms and maybe below 300 if possible.
There are two red ones: domContentLoadedTime and frontEndTime. That is when your Document Object Model (DOM) is ready and the frontEndTime is how much time is spent processing in frontend (the difference between the loadEventStart and the responseEnd in the Navigation Timing API). You want them to be as small/happen as early as possible.
I also use the User Timing API to collect my own measurements. One is executed right after the header (headerTime) and the other on page load for the main logo image (logoTime) on the start page:

Since I run the test from Stockholm and the server is located somewhere in the US, there are some latency. And latency is a killer. This the typical use case for using a CDN.
One good thing running an open source project, is that Fastly actually supports open source projects for free! Fastly is easy to setup by default (and you can also do much complicated stuff if you want). Note: I'm not here to sell Fastly, there are other CDN:s you can use (I use Fastly because I was quite impressed by a talk by Artur Bergman at the Velocity Conference in London).
It took me a couple of hours to get it up and running, testing and verifying. Great www.sitespeed.io is now using a CDN, what will now happen when I try to fetch it from Stockholm?
Using a CDN
Here is the result of the test using a CDN, fetching from Stockholm:

Wow, the frontEndTime & the domContentLoadedTime has decreased alot and the firstPaint is 386 ms, that is sweet! Also my custom user timings has decreased. Great!

The really cool thing with Fastly is that they also have servers in Asia, Africa and South America so it will actually help user from all of the world. How will that actually affect the site? I will test it using the wonderful webpagetest.org.
Testing from different locations
I will test the site from Tokyo and from Miami. Tokyo is cool because sitespeed.io is popular in Japan and I want the site to be fast there. And I want to test from Miami to see if the CDN can improve the speed within US.
Tokyo without CDN
Testing from Tokyo, running 9 times using Chrome, testing the start page.

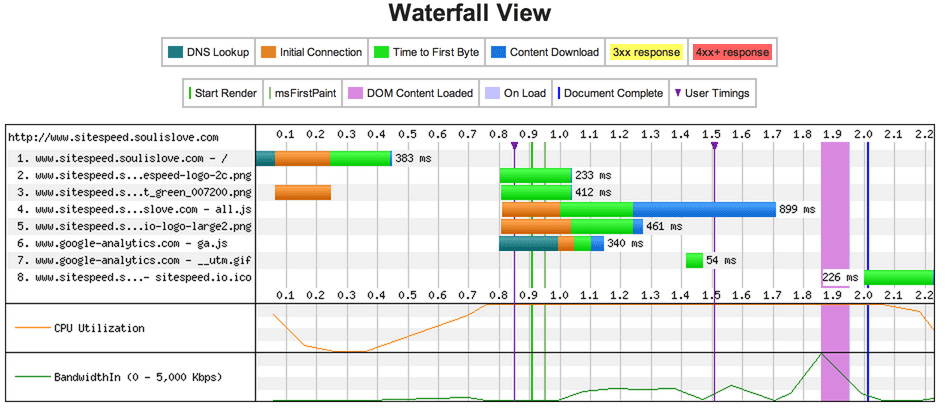
And getting the following waterfall for the median run:

Tokyo with CDN
And with the CDN:

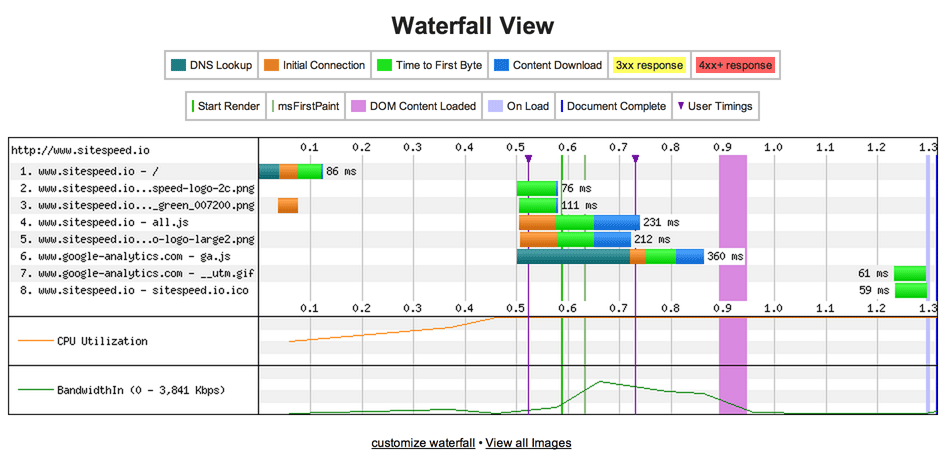
And getting the following waterfall for the median run:

Wow, you see that the time to the first byte and the start render got much better using a CDN (for the first request). You see that the repeated request doesn't get so good, I need to dig into that, guess it could have to be that all the CSS is included in the HTML?
By the way: it seems like a long DNS lookup for Google Analytics (217 ms), much longer than looking up www.sitespeed.io. I have tested it a couple of times and always get long lookup times for GA in Tokyo. Anyone else seen that?
Miami without CDN
I also tested from Miami, since it is interesting to see if I also get a decrease within US. Doing it the same way, testing nine runs.

Miami with CDN
And then accessing the site through the CDN.

Yes, we cut 100 ms for the first byte, that also make the start render 100 ms faster, that is good! One interesting thing is that the repeated view in US has better start render values than the first view, when testing from Tokyo I didn't get the same values.
Summary
The CDN really helped me out. I decreased the firstPaintTime from Stockholm by almost 250 ms, that is really good! And I did it by just by configuring a CDN! Lets see what else I can do to make it even faster. More blog posts coming up!
Written by: Peter Hedenskog